

Daily Commentary
Commentary prepared by Alloya Investment Services(opens in new tab), a division of the wholly owned CUSO of Alloya Corporate Federal Credit Union. Alloya Investment Services is a leading broker/dealer consultant to credit unions.
Friday, July 31, 2026 at 8:00 am CT
Commentary prepared by Tom Slefinger, Market Strategist
Market Indications
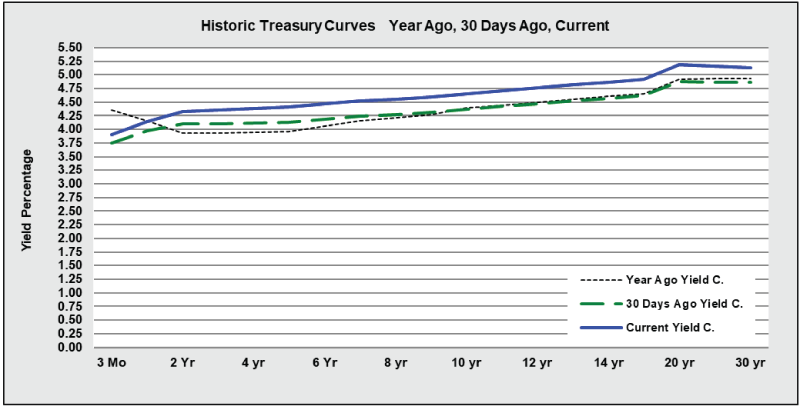
Other Market Indicators
| Market Indicators | ||
|---|---|---|
| 2s/5s Tsy Spread | 0.14 | -0.01 |
| 2s/10s Tsy Spread | 0.41 | -0.01 |
| 2s/30s Tsy Spread | 0.95 | -0.02 |
| DJIA-30 | 52,208.06 | +1.19 |
| S&P-500 | 7,437.63 | +1.66 |
| NASDAQ | 25,122.18 | +2.78 |
| Dollar Idx | 100.19 | +0.33 |
| WTI | 84.02 | +0.51 |
| 4,086.34 | 4,110.70 | +0.00 |
Daily Commentary
Recap — The rebound in global chip stocks is extending into Friday. Dow futures are up well over +300 points at the moment. Even with Thursday’s gains, Micron’s stock is down about -24%, Intel has lost -35% and AMD is -16% lower over the past month. So, even as the primary beneficiaries of the continued increase in hyperscaler capex budgeting have been going through the wringer, it has not rained on anyone’s parade.
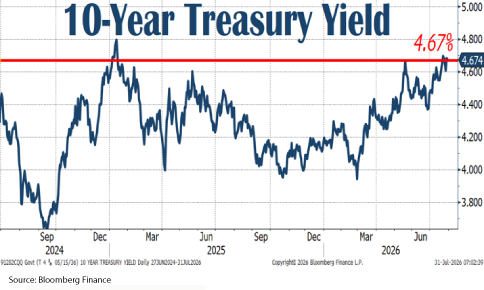
At the same time, bonds cannot find a bid. The 10-year Treasury benchmark is at 4.67% and approaching the cycle peak of 4.8%. The long bond is yielding and is trading at nearly a 20-year high of 5.21%. The long end of the curve is being pressured by inflation, fiscal problems and hyperscaler issuance.
Meanwhile, the 30-year fixed rate mortgage just hit a one-year devilish high of 6.66% this week (from 6.58% the week before). According to Redfin, U.S. pending home sales in the four weeks ending July 26 sagged to their lowest level since early April (the latest week showing a huge -1.7% falloff). It comes as no surprise that homebuilding stocks have rolled over again and are down nearly -17% from the pre-war nearby high.
Yesterday, the bond market could not have asked for a cleaner setup, at least in theory. Real GDP growth for Q2 undercut expectations with a +1.5% annualized growth rate while the market was looking for a +2.0% print. And that came with a better tone to the consumer, where personal consumption accelerated to a +3.2% annualized rate in real terms from +0.5% in Q1 (consensus was +2.3%). Keep in mind that this past quarter contained the One Big Beautiful Bill Act (OBBBA) tax goodies, the World Cup and the earlier timing of Amazon Prime Day. One can reasonably expect a big deceleration for this quarter and likely Q4 as well, with the sharp but brief sources of support fading away.
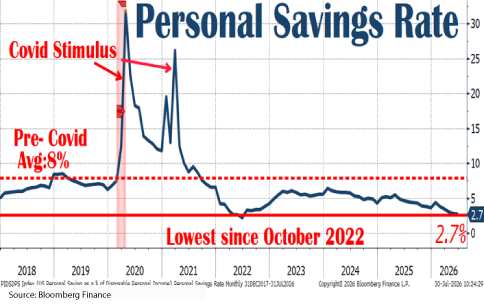
Frankly, if not for the fact that households, some of which are feeling a lot wealthier, have been willing to spend at a pace far above their income, we would have practically seen no growth in real consumer spending over the past year. Question is, can a four-year-low personal savings rate at a mere 2.7%, far below the long-run norm of 8% (back to 1970), be sustained?
Of all the numbers, the one that should be speaking the most to the bond market was that light print on the core PCE deflator in June. As an aside, the headline PCE fell -0.1% month-over-month. The core PCE deflator came in light at +0.1% month-over-month, the softest pulse since March 2025 and below the +0.2% consensus estimate.
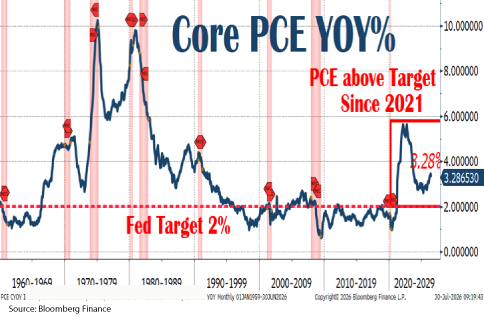
The key number for bonds was the light June core PCE print. The old “Powell Supercore,” services excluding energy and shelter, rose just +0.1% for the second time in three months. This matters because it signals whether labor slack is building.
Digging through the details, the Fed should take some comfort in how broad the disinflation was across both goods and services.

Stay tuned and have a great day!
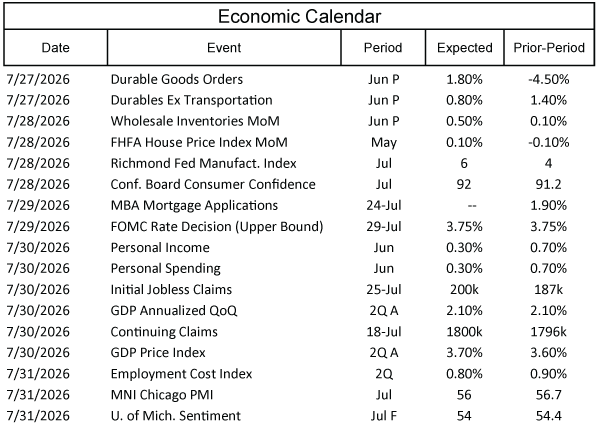
Economic Calendar
July 27 - 31, 2026
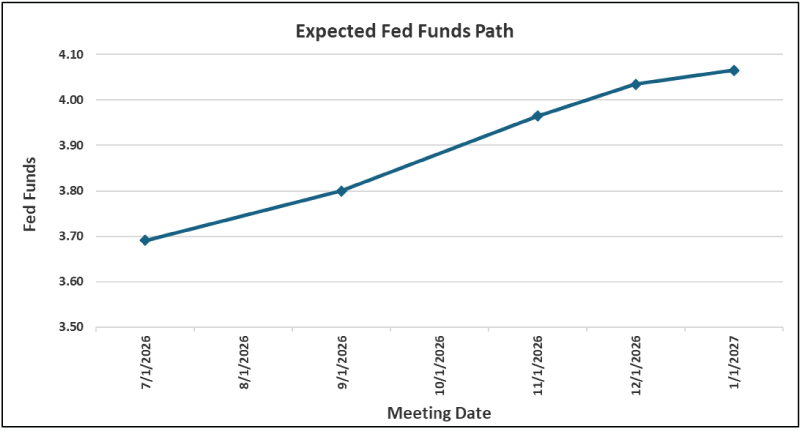
Future Fed Expectations
Source: Bloomberg

as of 7/27/2026
| Select Probabilities based on the Futures | |
|---|---|
| Probability of Fed Funds rate HIKE on July 29, 2026 | 34% |
| Probability of Fed Funds rate HIKE on September 16, 2026 | 72% |
**All quoted rates are indications and are subject to change without notice.
* ISI is a member of the FINRA/SIPC.
The information contained herein is prepared by ISI Registered Representatives for general circulation and is distributed for general information only. This information does not consider the specific investment objectives, financial situations or particular needs of any specific individual or organization that may receive this report. Neither the information nor any opinion expressed constitutes an offer, or an invitation to make an offer, to buy or sell any securities. All opinions, prices, and yields contained herein are subject to change without notice. Investors should understand that statements regarding future prospects might not be realized. Please contact Alloya Investment Services to discuss your specific situation and objectives.